
Nordstrom Stock Looks Attractive
/https://specials-images.forbesimg.com/imageserve/5fed703ebe8b827fa5246d56/0x0.jpg "Nordstrom Stock Looks Attractive")
NEW YORK, UNITED STATES – 2020/10/27: People wearing face masks walk past a Nordstrom Department … [+]
Nordstrom’s stock (NYSE: JWN), the upscale specialty retailer offering apparel, shoes, cosmetics, and accessories for women, men, and children, became vulnerable due to its non-essential product assortment during the pandemic. Consequently, the company’s stock has lost 24% of its value so far this year, and currently stands at around $31. However, we believe it to be a good time to enter this stock as it could see a strong upside once the Covid-19 fear abates. This is taking into account the company’s better-than-expected Q3 performance, Covid vaccine news, growing digital presence, and a $1.5 billion of total available liquidity. Our conclusion is based on our detailed comparison of Nordstrom’s stock performance during the current crisis with that during the 2008 recession in an interactive dashboard analysis.
In Q3, the retailer posted surprise earnings per share of $0.34, down 54% year-over-year, but easily beating analyst expectations of a loss of $0.06 – showing that the company has adapted to difficult conditions during the pandemic. It should also be noted that digital sales were a bright spot in the recent quarter, increasing 37% y-o-y and making up 54% of total sales. Going forward, Nordstrom plans to continue chasing growth in stronger merchandise categories like activewear, beauty, and home. In fact, it can also benefit from a rebound in sales of dressier apparel styles as people return to the office and start going to big social events again post Covid.
2020 Coronavirus Crisis
Timeline of 2020 Crisis So Far:
- 12/12/2019: Coronavirus cases first reported in China
- 1/31/2020: WHO declares a global health emergency.
- 2/19/2020: Signs of effective containment in China and hopes of monetary easing by major central banks helps S&P 500 reach a record high
- 3/23/2020: S&P 500 drops 34% from the peak level seen on Feb 19, as Covid-19 cases accelerate outside China. Doesn’t help that oil prices crash in mid-March amid a Saudi-led price war
- Since 3/24/2020: S&P 500 recovers 63% from the lows seen on Mar 23, as the Fed’s multi-billion dollar stimulus package suppresses near-term survival anxiety and infuses liquidity into the system.
Nordstrom’s Performance During 2020 Coronavirus
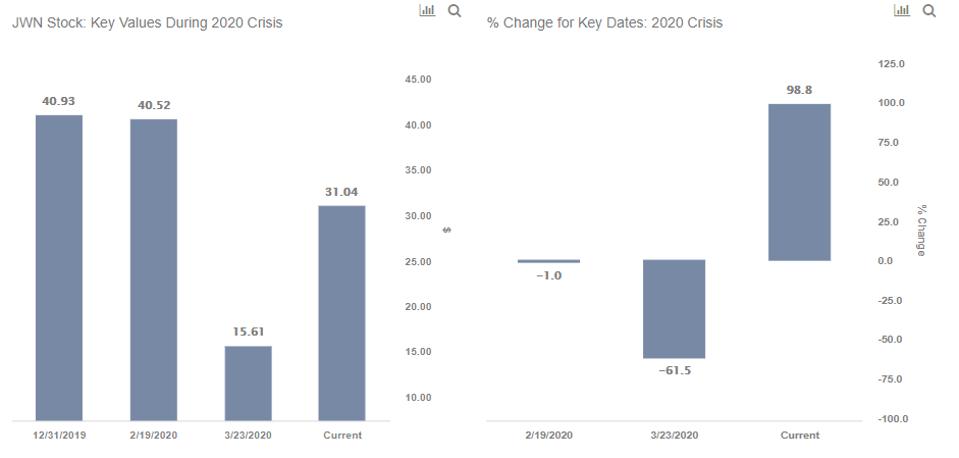
JWN stock declined from levels of around $41 in mid-February (the pre-crisis peak) to roughly around $16 as of March 23 (as the markets bottomed out) – implying that the stock lost as much as 62% of its value from its approximate pre-crisis peak. It then rallied to levels of around $31, rising by 99% since March 23. However, it is still down 24% from levels of around $41 seen in early January.
S&P 500 Index Performance During 2020 Coronavirus/Oil Price War Crisis
The S&P 500 index declined from levels of around 3,386 in mid-Feb (pre-crisis peak) to levels of around 2,237 as of Mar 23 (as the markets bottomed out), implying the index lost 34% of its value from its approximate pre-crisis peak. It then rallied to levels of about 3,739 currently, rising by 67% since Mar 23. It is also up 16% from levels of 3,231 seen in early January.
2007-08 Financial Crisis
Timeline of 2007-08 Crisis
- 10/1/2007: Approximate pre-crisis peak in S&P 500 index
- 9/1/2008 – 10/1/2008: Accelerated market decline corresponding to Lehman bankruptcy filing (9/15/08)
- 3/1/2009: Approximate bottoming out of S&P 500 index
- 1/1/2010: Initial recovery to levels before accelerated decline (around 9/1/2008)
Nordstrom’s Stock Performance Over 2007-08 Financial Crisis
JWN stock witnessed something similar during the 2008 downturn. JWN stock declined from levels of around $48 in October 2007 (the pre-crisis peak) to roughly $13 in March 2009 (as the markets bottomed out) – implying that the stock lost as much as 72% of its value from its approximate pre-crisis peak. However, JWN stock recovered post the 2008 crisis, to levels of about $38 in early 2010, rising by 179% between March 2009 and January 2010.
S&P 500 Performance Over The 2007-08 Financial Crisis
S&P 500 Index fell 51% from levels of 1,540 in September 2007 to 757 in March 2009. It then rallied to levels of 1,124 – rising by about 48% between March 2009 and January 2010.
Fundamentals
How Do Nordstrom’s Fundamentals Look In Recent Years?
Nordstrom’s revenues grew 4% from $14.5 Bil in 2016 to $15.1 Bil in 2019. In addition, earnings growth, on a per-share basis, was higher by 57% between 2016 and 2019.
Survival Check
Does Nordstrom’s Have A Sufficient Cash Cushion To Meet Its Obligations Through The Coronavirus Crisis?
Nordstrom’s total debt declined from $2.8 billion in 2016 to $2.7 billion in 2019, while its total cash was around $900 million in 2019. The company also generated close to $1.2 billion in cash from its operations in 2019.
CONCLUSION
Phases of Covid-19 crisis:
- Early- to mid-March 2020: Fear of the coronavirus outbreak spreading rapidly translates into reality, with the number of cases accelerating globally
- Late-March 2020 onward: Social distancing measures + lockdowns
- April 2020: Fed stimulus suppresses near-term survival anxiety
- May-June 2020: Recovery of demand, with the gradual lifting of lockdowns – no panic anymore despite a steady increase in the number of cases
- July-November 2020: Weak Q2 and Q3 results, but continued improvement in demand and progress with vaccine development buoy market sentiment
Despite the recent surge in the number of new Covid-19 cases in the U.S., we expect continued improvement in demand to buoy market expectations. As investors focus their attention on expected 2021 results, we believe Nordstrom’s stock has the potential for strong gains once fears surrounding the Covid outbreak are put to rest.
Trefis
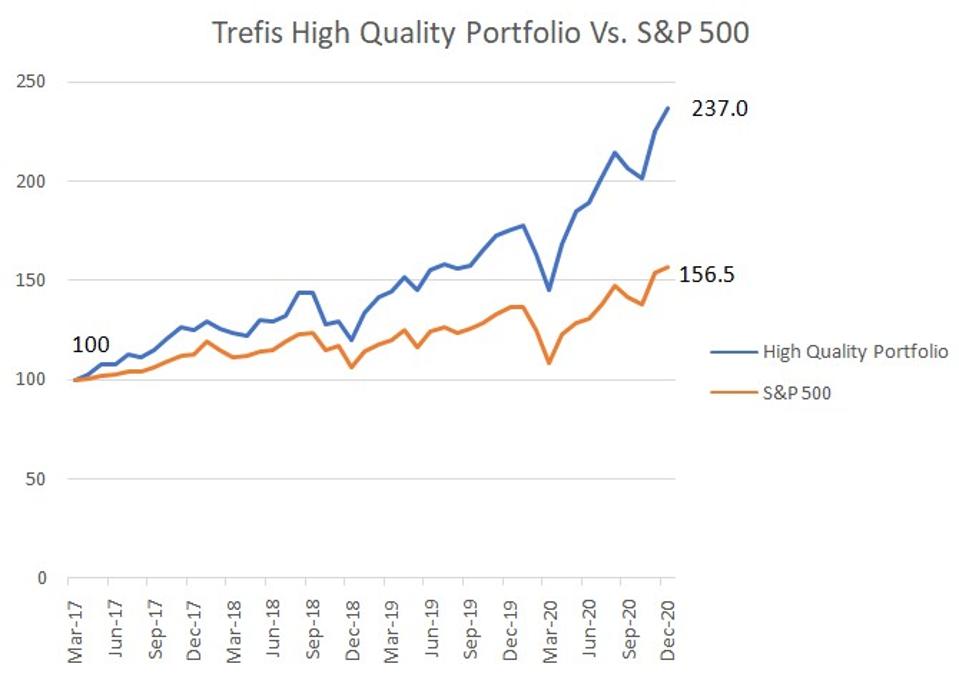
What if you’re looking for a more balanced portfolio instead? Here’s a high-quality portfolio to beat the market, with over 100% return since 2016, versus 55% for the S&P 500. Comprised of companies with strong revenue growth, healthy profits, lots of cash, and low risk, it has outperformed the broader market year after year, consistently.
See all Trefis Price Estimates and Download Trefis Data here
What’s behind Trefis? See How It’s Powering New Collaboration and What-Ifs For CFOs and Finance Teams | Product, R&D, and Marketing Teams


